
Hello,
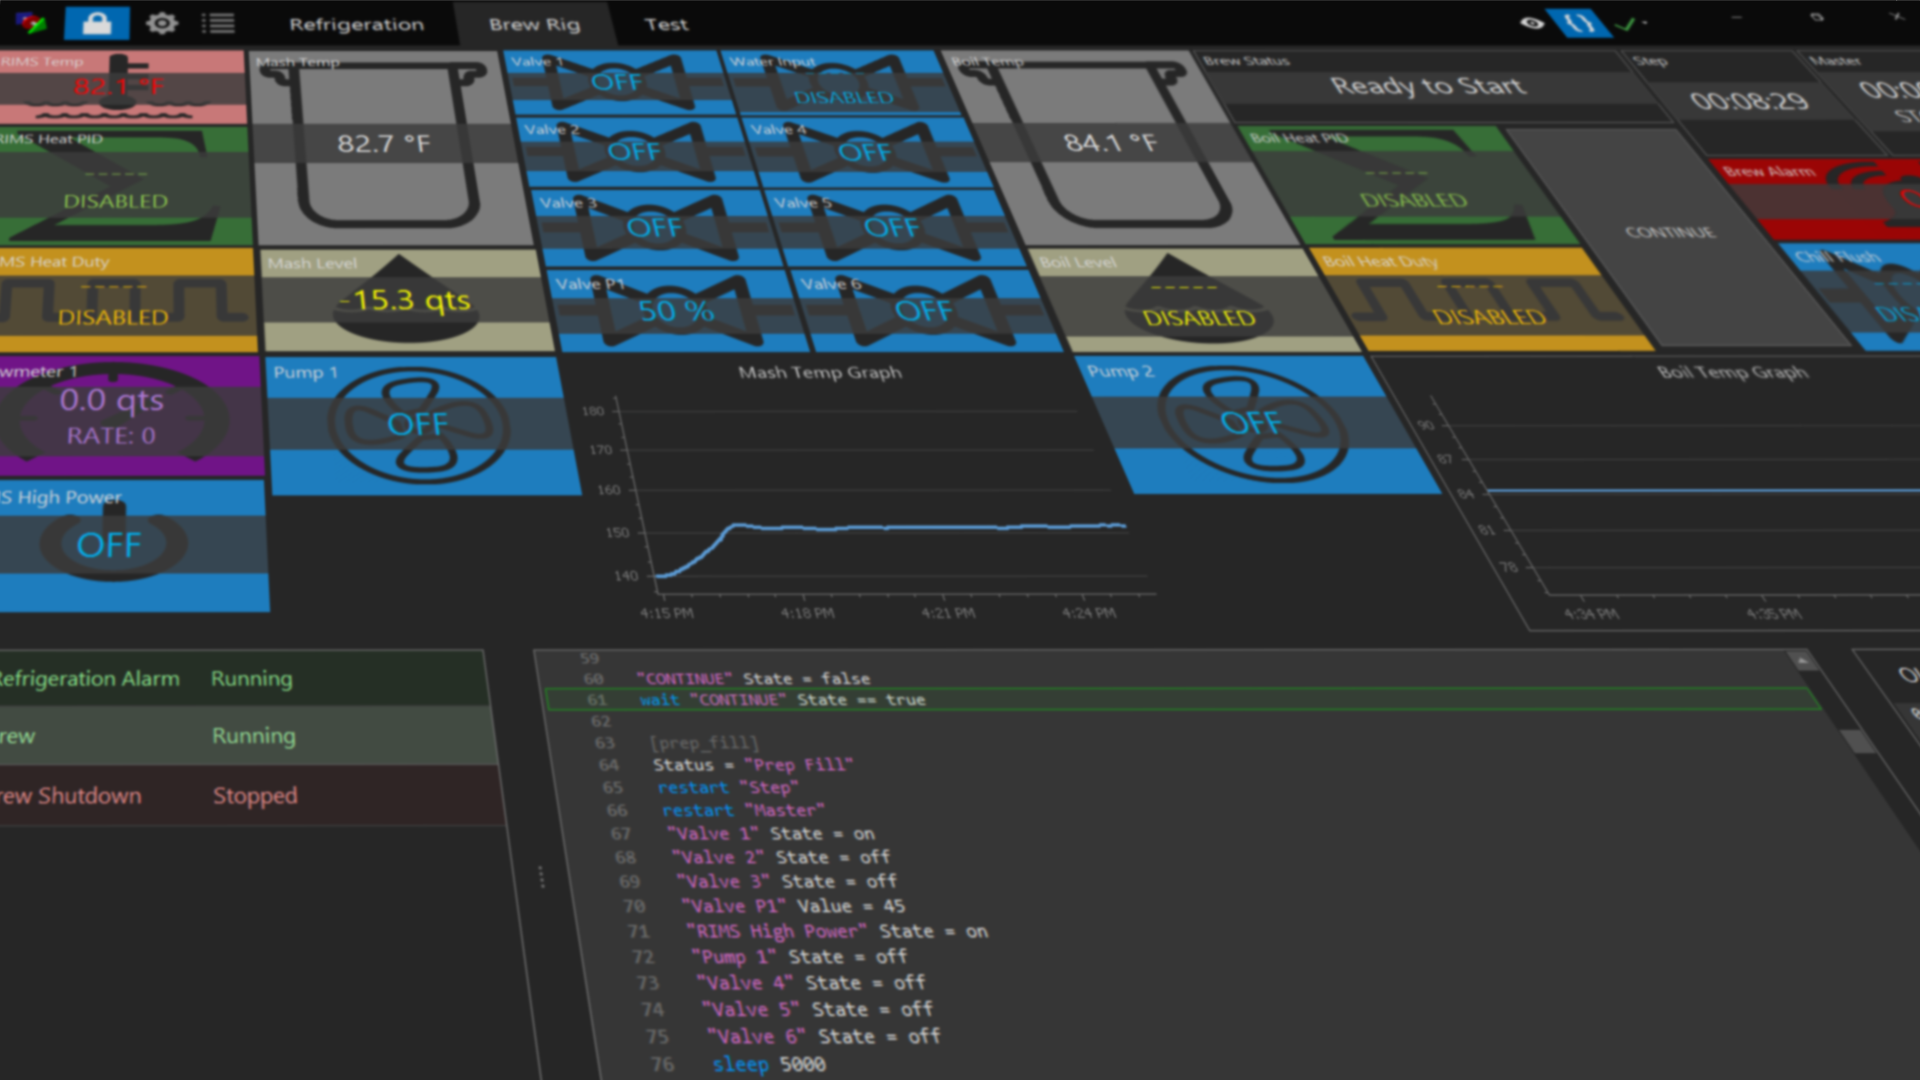
Just offering this from the 1.1.0.15 build, noting that it's the current BETA. Since upgrading from 1.1.0.4, I started getting these .NET Framework unhandled exception warnings. It seems to do with the graphs. I don't have any additional details to give other than BC runs in the background, tracking what it does, and this just crops up on its own. if I don't have any devices activated for tracking, no warning like this, but when I have devices enabled and let them run for a while (with the graphs showing the data), I get this.
*********** Exception Text ***********
System.ArgumentException: Parameter is not valid.
at System.Drawing.Graphics.CheckErrorStatus(Int32 status)
at System.Drawing.Graphics.DrawLines(Pen pen, PointF[] points)
at DevExpress.XtraCharts.Native.Renderer.DrawLines(LineStrip strip, Color color, Int32 thickness, LineStyle lineStyle, LineCap lineCap)
at DevExpress.XtraCharts.Native.LineSeriesViewPainter.RenderLine(Renderer renderer, Rectangle mappingBounds, LineWholeSeriesLayout lineLayout, LineStyle lineStyle, Color lineColor, LineCap lineCap, LineSeriesView lineView)
at DevExpress.XtraCharts.Native.LineSeriesViewPainter.RenderLine(Renderer renderer, Rectangle mappingBounds, WholeSeriesLayout layout, LineDrawOptions lineDrawOptions, Color lineColor)
at DevExpress.XtraCharts.Native.LineSeriesViewPainter.RenderWholeSeries(Renderer renderer, Rectangle mappingBounds, WholeSeriesLayout layout)
at DevExpress.XtraCharts.PointSeriesViewBase.RenderWholeSeries(Renderer renderer, Rectangle mappingBounds, WholeSeriesLayout layout)
at DevExpress.XtraCharts.Native.XYDiagramSeriesLayout.RenderWholeSeries(Renderer renderer, HitRegionContainer seriesHitRegion)
at DevExpress.XtraCharts.Native.SeriesContainerLayout.RenderSeries(Renderer renderer, XYDiagramPaneAreas paneAreas)
at DevExpress.XtraCharts.Native.XYDiagramPaneViewData.RenderSeries(Renderer renderer)
at DevExpress.XtraCharts.Native.XYDiagramPaneViewData.Render(Renderer renderer)
at DevExpress.XtraCharts.Native.XYDiagramViewData.Render(Renderer renderer)
at DevExpress.XtraCharts.Native.ChartViewData.Render(Renderer renderer)
at DevExpress.XtraCharts.Native.ViewController.RenderChart(Renderer renderer, Rectangle bounds, Boolean lockDrawingHelper, IRenderContext renderContext, ChartViewData viewData, Boolean autoLayoutUpdated)
at DevExpress.XtraCharts.Native.Chart.Render(Rectangle bounds, Boolean lockDrawingHelper, ChartViewData viewData, Boolean autoLayoutUpdated)
at DevExpress.XtraCharts.Native.Chart.DrawContent2D(IRenderContext renderContext, Rectangle bounds, Boolean useImageCache)
at DevExpress.XtraCharts.Native.Chart.DrawContent(Graphics graphics, INativeGraphics nativeGraphics, Rectangle bounds, Rectangle windowsBounds, Boolean lockDrawingHelper, Boolean useImageCache, GraphicsQuality graphicsQuality)
at DevExpress.XtraCharts.Native.Chart.DrawContent(Graphics graphics, Rectangle bounds, Boolean useImageCache)
at DevExpress.XtraCharts.ChartControl.OnPaint(PaintEventArgs e)
at System.Windows.Forms.Control.PaintWithErrorHandling(PaintEventArgs e, Int16 layer)
at System.Windows.Forms.Control.WmPaint(Message& m)
at System.Windows.Forms.Control.WndProc(Message& m)
at DevExpress.XtraCharts.ChartControl.WndProc(Message& m)
at System.Windows.Forms.NativeWindow.Callback(IntPtr hWnd, Int32 msg, IntPtr wparam, IntPtr lparam)
On a separate matter with the graphs, I note they like to clear out and reset any time their settings are changed. I guess I'd need to go back to 1.1.0.4 to see if the same things happen, but I feel that in 1.1.0.4, I could change the time span and still have the data appear, just at a different scale. Also, if I open the graph settings and click OK without changing anything, the graph completely clears.
Hopefully, this is helpful as the BETA develops!
Cole
Actually, I now see a 1.1.0.16 update for BETA. I will download that and see how it plays with the graphs and exemptions. Sorry if you already addressed these issues since 1.1.0.15.
Alright, so in 1.1.016, the graph still resets itself if I alter the timeline or simply open the settings and click OK without changes. I'll watch for the .NET warning
Can you close BruControl, then re-open it. Then email us the "controller.xxxx.log" from the Documents/BruControl/Logs folder? Here, xxxx is the date code of the day the file was created - no need to worry about that, just send the most recent one.
I had just updated to 1.1.0.16 and have been running that for a few hours. I'll send the log still in case it is a running log, but just FYI. Thanks!
In case someone experiences this, the issue was assuming I had SqlLocalDB installed on this PC when I had it on my old PC. Installing this based on the release product notes resolved my graphing issues off the bat, so I suspect it will work fine going forward.
Thanks!
