A feature I have built into my website which I really like is the ability to set dynamic max/min values for graph axis ranges.
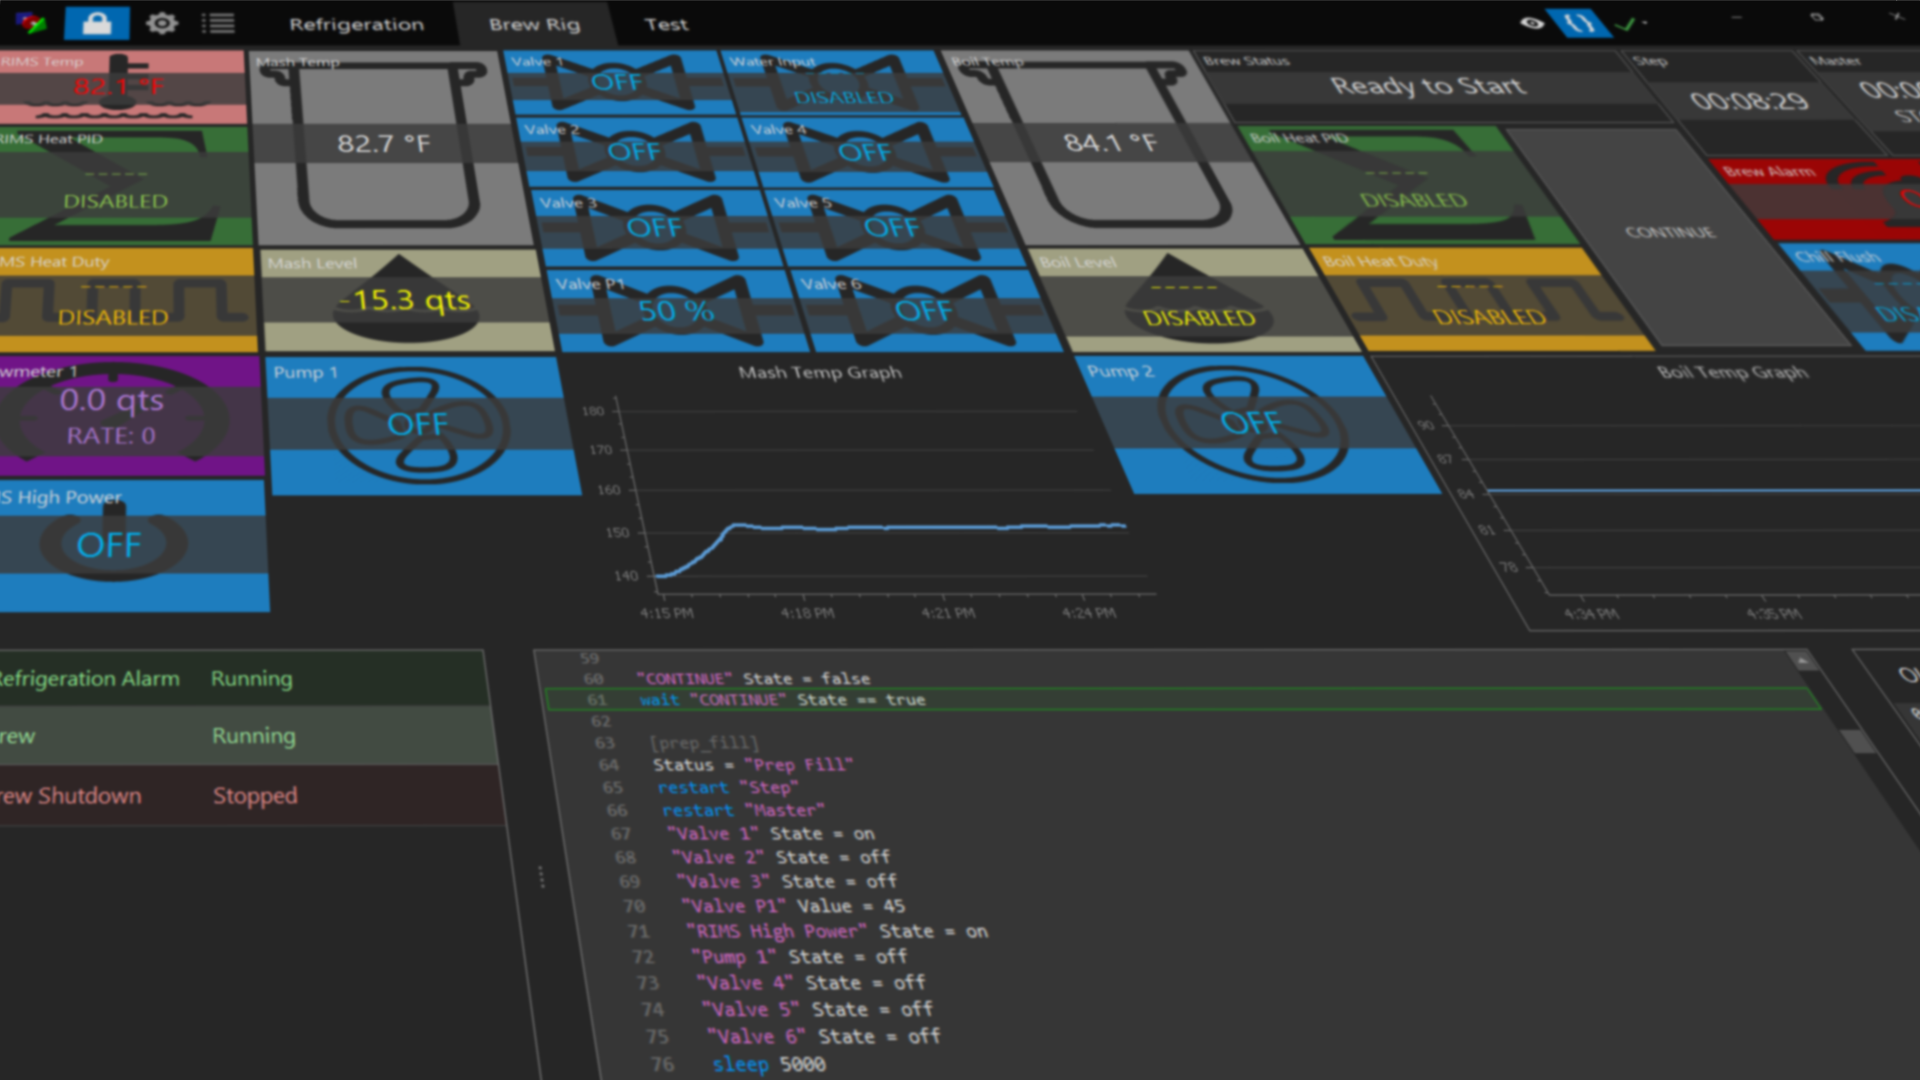
Have a look at the attached image. You can't really see the temp swings on the set temp of 3 degrees because I have the temp range set to cover my ferment temps as well.
In my website I have the max/min values dynamically set to +/- 5 for the max/min values displayed in the graph. That way the graph auto-adjusts to values and "zooms" in automatically.
Sorry, I’m not following. You can set min and max to be automatic in BruControl. Can you explain what you are looking for?
The problem I have with the automatic settings is that I am plotting actual temperature vs target temperature. The 2 axis have different scales so a 19 degree actual temperature does not plot directly against a 19 degree target temperature.
e.g: 19 degree actual temp plot does not sit on top of 19 degree target temp plot
You can see the 2 scales do not match up with 3.75 actual temp plotting against 3.10003 target temp
I understand... Not sure how to solve this... would we just make the one side dynamic?
Maybe allow a setting to bind multiple "sources" to the same "value", using your setting names.
In my case, I'd like to bind the actual and target readings to the same axis.
And perhaps a zoom feature on the graph, so you can zoom out from the values. My current graph using auto-values is pretty unhelpful. 🙂
